Friday, July 25, 2008

Investment philosophy, process and outcomes

In some regards investing is like dieting. It only works if you have a good philosophy, good plan, and you stick to it over the long term. So what is our investment philosophy at the Suburban Economic Investor?

Investment philosophy
We are strategic, top-down investors. This means we invest according to macro-economic trends. We select relatively few investment asset classes, we abore excessive diversification and the notion of buy and hold for the long term. We don't trade; our ideal is 1-2 major investment decisions per year if that. Our heroes' are sage investors like Jim Rogers and Marc Faber who correctly picked commodities and China as boom investments (and the US as a poor one), and we smart enough manage those investments to protect downside. Our economist heroes' include Nouriel Roubini (RGE) and Paul Kasriel (NTRS).
So how does it work. Four simple steps based on foundation knowledge of financial and economic concepts.
  1. Monitor and understand the global economic situation
  2. Select asset classes likely to benefit (high positive economic value) over the medium term
  3. Select individual investments within these asset classes
  4. Manage entry, risk and exit to investments
For example. In 1999 our sage heroes' Rogers and Faber identified commodities as a group where at two decade generation lows. They also understood the central banks were printing excess money and that real rates would become negative which was bullish for commodities, and bearish for the USD. In 2003 they recognised China's entry to the WTO would spark a huge boom in that country. In 2006 these sage's went short financials recognising the imminent US housing bust. In 2007 they went long agriculture stocks. We don't pretend to be able to match this performance, but we do intend to 1) understand the fundamentals, 2) follow the global economy, 3) follow the sages by selecting good asset classes, 4) manage risk in our investments carefully.

Investment process versus outcomes
Investing is a probabilistic field in which both the likelihood and payoff for a decision in important (more on this later). In these fields the long-term investment philosophy and process are more important than short-term outcomes. We can control our investment philosophy, but we can't control short-term outcomes. Consider that in the following matrix:
We can't control the market, but we are aiming for an investment process which will deliver either deserved success or unlucky outcomes. We don't want to confuse blind luck with investing genius on our behalf. This 2 dimension by 2 dimension (2 x 2) matrix introduces both game theory and expected value concepts which are highly important to financial and life decision making. At its simplest we consider the performance what we can control (our investment process), with that which we can't control (market outcome). A useful concept for making all sorts of decisions with imperfect information.

Wednesday, July 23, 2008

Primary, secondary and tertiary economies

In this post we look at the GDP (gross domestic product) of the largest 20 nations. We first divide the these nations into primary (commodities), secondary (manufacturing/services) and tertiary (IT, advanced manufacturing, consumer) nations. We then group these nations into a simple trading model between primary, secondary and tertiary nations. Without further ado, here are the top 20 nations GDP based on 2007 data. Note the list reflects my simple categorisation based on the nations primary role. All nations are ultimately primary, secondary and tertiary producers at different levels.

Primary Producing Nations (predominantly):
  • Canada USD$1.43 trillion
  • Brazil USD$1.31 trillion
  • Russia USD$1.29 trillion
  • Australia USD$0.91 trillion
  • Mexico USD$0.89 trillion
  • Turkey USD$0.66 trillion
  • Indonesia USD$0.43 trillion
  • Saudi Arabia USD$0.38 trillion
  • Iran USD$0.29 trillion
  • South Africa USD$0.28 trillion
  • Argentina USD$0.26 trillion
  • Venezuela USD$0.24 trillion
  • TOTAL: USD$8.38 trillion
Secondary Producing Nations (predominantly):
  • China USD$3.25 trillion
  • India USD$1.10 trillion
  • South Korea USD$0.96 trillion
  • Taiwan USD$0.38 trillion
  • Thailand USD$0.25 trillion
  • TOTAL USD$5.94 trillion
Tertiary Producing Nations (predominantly):
  • European Union USD$16.83 trillion
  • United States USD$13.84 trillion
  • Japan USD$4.38 trillion
  • TOTAL USD$35.057
The following graphic illustrates the relative size of these three trading blocks.
What to draw from this? Well, in my humble opinion we can divide all spending into either consumer or government spending. Consumer spending includes housing, energy, food, and discretionary retail spending; plus commercial spending related to meeting consumer markets. For example Boeing building 787 aircraft is ultimately consumer spending as the end user of that product are consumers. Government spending on the other hand is either consumer spending (healthcare, education) or nation building (infrastructure, defence).

My point here is that consumer spending is a huge part of tertiary nations' GDP. Any hiccup to western consumer spending brought about be rising food, energy or credit costs, combined with reduced employment prospects based on recessionary fears is a big issue. Can the primary and secondary nations de-couple from tertiary nations and become power world economy? These countries were very coupled on the way up, will they couple as the west heads south?

Based on this simple analysis it would
seem they will stay coupled on the way down. A western recession (US, EU, Japan) is a global recession. Keep a close eye on what happens in the US and EU economies as an indicator for your local economy.

For the record, the GDP of the top 35 nations is shown below along with their cumulative contribution to global GDP. Note again how important western 'credit ladden' nations are to this picture.


Friday, July 18, 2008

Inflation, money, things & people

"Inflations is always and everywhere a monetary phenomenon".

Increasing money supply
Let's play monopoly. Only this time with a twist. We have one board, one set of properties, hotels, cards etc. However we have two sets of monopoly money. Here's how we play. For the first hour we play one set of properties, one set of money. At the end of the first hour add the second set of money, shared amongst all the players. What do we notice? We would notice a step change (increase) in the general level of prices as players bought and sold properties. Such a step change would be immediately obvious and would (rightly) be attributed to the extra cash added to the game.
Now let's be sneaky. Again we start play with one board, one set of properties, hotels, cards etc, and one set of money. However in this game, every time a player passes GO we secretively give him extra cash to the tune of 2% of his current position (cash + properties). After 35 rounds (about 4 hours), there is twice as much money circulating as before (1.02^32 = 1.99), except the players are not aware of this fact.
So what do the player notice? Fabulous returns on property!! "I bought Mayfair for $400, and sold it 2 hours later for $600. I then bought all the utilities for $800 and had them at the end worth $1600. How clever am I!!" What else would we observe? Well the fines and rents seemed increasingly trivial as the game went on (hint, they're not indexed to inflation).
Welcome to life. In reality we have more than just property as an asset class. With inflation we see the prices of bonds, property, commodities, equities all rise, though not necessarily in synch. The central banks can add money, but they can't say where it will go. So what happened? Bonds rose, equities rose (and peaked 2000), real estate rose (and peaked ~2006), commodities rose (and possibly peaked 2008).
Money supply versus physical goods
So let's play monopoly again. This time after the first hour let's double the board (properties, hotels, players), but keep just one set of monopoly money. What would we notice? Sharp property price falls as the same amount of money was shared by more player bidding on more properties. Oh my goodness, we'd have massive deflation, a monopoly depression!!
Okay, let's try a different game. Play with one board and one set of money, but after 1 hour we remove half of the money by making players hand it over. If need be they have to sell their assets to do so. Again we have falling prices and a monopoly depression.
Money supply growth, population growth and productivity
It's all relative in a growing economy. If we double the monopoly board and double the money, we won't see different prices, just a bigger game. In the real world increasing the 'board' is achieved through population growth (birth rate, immigration, death rate); while increasing physical stuff is achieved through productivity growth (more with less, technology, science, innovation etc). Globalisation also plays a part as production and services are procured from overseas workers. Increasing the amount of money is achieved by increasing central bank money (M0), and commercial bank money (M1-M3).

Price stability - balancing growth in money, people, stuff
So here's my theory. Assuming stable population, innovation and productivity, inflation (general price levels) are always and everywhere a monetary phenomenon. The more correct general theory would be that inflation is function of money, population and goods growth.

The boom years 1980-2000
In a previous post I discussed asset price appreciation and reducing inflation (the great moderation). Following this thought further I believe we can see macroeconomic factors in light of money supply, population and goods growth.

Global Money Supply
T
otal money supply growth has clearly been at high levels since the 1980s. In recent times we have seen extensive money growth in many nations as they try to competitively devalue their currencies. See the chart at left based on data 2007 money supply from Wikipedia. This is clearly inflationary, but what has happened to population growth?

Global Population Growth
Well nothing abnormal in an absolute sense, but in a productive capacity we have added 3 billion Chinese, Indians, Brazilians, Thai's, Malaysians, Vietnamese and so on. That is clearly deflationary.

Global Productive Growth
Three things have impacted productive capacity. First, industrial/digital inventions such as computers, internet, biotec, agri-tec and so on. Second, business management techniques have improved (lean six sigma, just in time manufacture, ERM, CRM and so), and are more standardised through global companies. Thirdly, more countries are now moving into manufacturing so more 'stuff' is being made.

From the mid 1980's I belive that productive growth + population growth exceeded money supply in the financial economy. That's why inflation moderated with all the benefits associated with price stability.

In the current situation (2008), money supply is contracting due to the credit crisis (banks have lost too much money) whilst population and productive growth is stable. This calls for general price deflation according to my model. Of course the (asset) price reductions won't be even. We have already had trillion dollar real estate and equity losses. So it is not unsurprising to see some rises in bond and commodity prices. Look for more of the same over the medium term.

Thursday, July 17, 2008

2008-07 SEI Global Review

I thought this topic would be a great first topic to commence the Monthly SEI Global Review. The information here comes from a variety of sources with emphasis on Nouriel Roubini (a total economic wizard).

0807 July SEI Global Review
The following is mostly a summary from Roubini:
  1. The credit crisis (starting with sub-prime) is the worst financial crisis since the great depression of the 1930's
  2. The crisis is related to subprime financial system (unsecured consumer credit, auto loans, sub-prime and alt-A housing, municiple bonds, industrial & commercial loans, hedge funds, corporate leveraged buy-outs)
  3. Credit losses will at least US$1 trillion, more likely US$2 trillion
  4. Hundreds of US banks, large and small with real estate exposure will go bankrupt
  5. Some major financial institutions while insolvent, will survive with government bailouts as they are too large to fail
  6. This will be the most severe US recession in decades
  7. The recession will be long, ugly and nasty, lasting 12-18 months
  8. The US consumer is shopped out, has no savings, highly indebted, has lost access to credit
  9. The US consumer is facing high food/energy prices, falling home prices, falling equity prices, falling incomes and job opportunities
  10. The US consumer is a very powerful economic force
  11. There will be no-decoupling by emerging markets
  12. Already 12 major economies are on the way to a recession
  13. US equity markets will likely fall 40% from their peak, (possibly worse in other areas)
  14. The housing bubble bust (2007) will lead to recession as it did with the 1980's housing bubble and the tech stocks bubble (1990s), except it will be MUCH worse this time around (as US housing is a much larger asset group)
  15. Inflation will eventually abate as the recession reduces demand for commodities (prices should fall 20-30%)
  16. The US Fed will lower rates to 0-1% to a) stimulate the economy, and b) recapitalise US banks
Five images of a global credit crisis:

US Housing Prices are in free-fall (perhaps another 20% to go)...
US Consumer is cutting back on all discretionary spending (housing/food/energy is all)...
US unemployment is rising (it will likely get worse)...
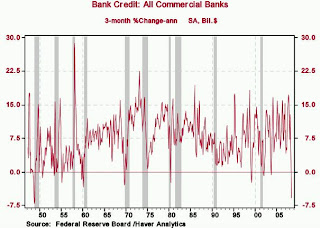
US Bank loans retracing dramatically, back to 1940s levels (bad for western credit nations)...Yet earnings still high relative to previous recessions (it will come)...The bad news isn't factored in yet (earnings and thus share prices have a long way to go)...
So investing thoughts?
  • Western equities (US, EU, EU, Canada, Australia, NZ...). More downside likely as Western nations enter either a recession or sharp slow down based on de-leveraging and credit contraction, as rising/high food and energy prices.
  • Developing equities (China, India, SE Asia...). De-coupling is not likely, food/energy impact is proportionally higher, inflation higher in these countries, export markets entering recession.
  • Bonds. Difficult question - if inflation risk > depression risk, yields will rise, prices will fall so short-term duration best. If depression risk > inflation risk, yields will fall further, so buy long bonds (or zero coupon long bonds).
  • Property. The global property boom is over on an affordability crunch. Consumer ability to borrow higher amounts crunched by higher interest rates, higher living costs and reducing employment certainty. Stay on the bench.
  • Commodities. Who knows? The supply/demand fundamentals look strong. But they did in the tech (2000) and housing (2006) bubbles too. Maybe time to take profits.
The US housing options market suggests a 2010 bottom for house prices. Perhaps late 09 is a time to re-assess. Until next months SEI Global Review that is...

Nouriel can be seen interviewed by Bloomberg here.

Wednesday, July 16, 2008

Money supply, bonds, property, equity and the Great Moderation

In this big post I try to pull together a theme to describe the last 20-30 years of investing.

One of the principle characteristics of this was the so-called 'great moderation' in inflation. This can be seen in the chart left since the early 1980s (courtesy of the US Cleverland Fed.)

In the next chart we see that inflation is reasonably reflected in in the US 10 yr Treasury yield. Notice how yield rose from 1960s lows to peak in the early 1980s then fall through to now. Note also the price of a notional 10 yr US Treasury bond works in reverse and we had large bond rises. In fact bonds, particularly zero-coupon long bonds have been a great investment.

We'll come to why at the end, but for now note in the chart below how bond prices have been rising as yields/inflation fall.
With inflation falling, shares increase in value. Why? Well a share price can be considered the current value (CV) of future cash flows from dividends over the long term. With falling inflation the discount rate (IR) falls, and the share CV becomes worth more. This is explained in 'What is NPV?' and the bond basics post. For now not that the S&P500 really took of when inflation started moderating as shown below:
Proof that much of the expansion in the S&P500 index was price to earning expansion is seen in the following long-term PE chart from Bob Bronson. Note Bob's forecast into 2012.
The next asset class is housing and this two has boomed relative to fundamentals (rents). The chart below shows US and Australian prices in real terms, in nominal the price gains are greater. Since 2006-7 we have seen house prices globally correct (US, UK, Spain, New Zealand, Ireland, Canada and now Australia).
The last major asset class is commodities. The chart below is from Martin Pring and shows commodity prices back to 1800. Martin suggests in a presentation that as of July 08, commodities are close to peaking (if not already).
So over the last 20 years we have had every major asset class (bonds, equities, housing and commodities) boom and peak (possibly for commodities). Why?

The answer seems to be an amalgam of reasons as listed below, followed by commentary on whether it is likely to continue.
  1. Excess money supply (M0-M3). Not likely to continue with high inflation (M0) and commercial banks repairing balance sheets from massive credit losses (M1-M3). See posts on money here.
  2. Further interest rate falls. Not likely as inflation rises and bond holders demand higher returns (discount rates) and bid lower prices for bonds.
  3. Globalisation benefits. The growth of China Inc. was responsible lower prices everywhere on account of lower wages. However with China inflation rampant, and the Yuan appreciating against the US, China import prices are rising.
  4. Low commodity prices. Commodities rose out of mid-80s lows to the current high levels. Whilst they may correct, it will take significant global demand destruction to do so (and this only occurs in a global recession/depression).
  5. Inventory management gains. The smoothing of supply chains was responsible for reducing economic volatility. These gains have been made.
  6. Reduced wage bargaining power. The late 80s and 90s where eras of conservative pro-business/anti-worker global governments in which workers lost bargaining power. The swing has been back to the worker so there are no more wage gains to be made.
In short, I believe the inflationary aspects of excess money supply where masked by items 2-6 above allowing the great moderation. However, that excess money supply found it's was sequentially into bonds (lower interest rates), equities (2000 peak), property (2006 peak), and now commodities (2008 peak).

Consumers everywhere are maxed out. In the developed world consumers borrow costs, access to credit and higher living costs are forcing a dramatic reduction in spending amist falling housing prices. In the developing world high commodities dramatically affect the cost of living which is the major purchase item, killing any discretionary spending that may have existed.

What can turn the global economy? BRIC nations (Brazil, Russia, India, China) spending on infrastructure as part of nation building? Maybe, but these nations export economies will suffer the in the global downturn so at best nation-building will offset this.

Be sure to check the SEI global review for more information as events unfold.

Tuesday, July 15, 2008

What is monetary and fiscal policy?

In this post we look at government monetary and fiscal policy and how that are related. Very interesting stuff when you follow the actions of governments (spending/taxes), and reserve banks (interest rates).

General Monetary Policy

The process by which central banks control 1) the supply of money, 2) the cost of money or interest rates, and 3) the availability of money. See 'What is money supply?'. Monetary policy can be expansionary which increases the supply of money in the economy (used to spur economic growth); or contractionary which does the reverse.
  • Expansionary policy. Total money supply can be increased by printing more money (increasing M0), lowering the cost of money (interest rates) and making easier to 'borrow' it into existence, and by lowering reserve and capital requirements on banks (allowing them to lend more). The US Federal Reserve has added an additional measure allowing banks to swap risky assets (code for assets that have lost most/all of their value, but the banks can't afford to admit it) for quality US Treasuries. This impacts their balance sheet and thus capital ratios by being able to account for the assets differently.
  • Contractionary policy. Reducing total money supply by printing less (or taking money out of circulation), raise the cost of money (interest rates), and raising reserve requirements.
Monetary Policy Targets

Governments control or direct different policy objectives with monetary policy. These include:
  1. Inflation targeting. Targeting a CPI rate of change, say 2-3% yoy, through changes to the overnight interest rate.
  2. Price level targeting. A specific CPI number, through changes to the overnight interest rate.
  3. Monetary aggregates. Targeting a CPI rate of change, say 2-3% yoy, by changing money supply (M0).
  4. Mixed policy. Targeting low (full) unemployment and low CPI change (low inflation).
  5. Gold standard. Targeting low inflation as measured by gold price by changing the fixed gold - currency rate.
Difficulties arise in monetary policy due to globalisation. With globalisation investment capital, and commodity prices are free to move across borders resulting in exchange rate fluctuations, whilst monetary policy is nation dependent. As of July 2008, we have the following quick summaries of monetary policy:
  • US. Expansionary - The Fed is stuck between inflation and a failing economy, as it has dual mandates of price stability (low inflation - stability in prices) and employment (sound economy).
  • China. Contractionary - Rampant inflation is being addressed with high and rising interest rates and increasing bank reserve requirements. However money supply is increasing (M0) as the Yuan is pegged to the USD, requiring China money printing and sales to artifically depress the Yuan.
  • EU. Contractionary - The EU Fed mandate is price stability (low inflation) and is raising interest rates to contract the EU economy in response to high CPI. The EU economy is believed to be close to stalling point.
  • Australia. The Reserve Bank is raising interest rates to slow a booming economy (based on the resources sector & government spending). Mandate is inflation targeting with yoy CPI 2-3%.
Fiscal Policy

Fiscal policy relates entirely to government spending. Like monetary policy, fiscal policy can expansionary or contractionary. Fiscal policy is expansionary when government spending exceeds income (money added to the economy), and contractionary when taxes exceed spending (money taken from the economy).

Governments spend of things like social programs, military/police, healthcare and education, as well as infrastructure like roads, airports and ports. Government spending can be funded through:
  1. Taxation. Or taxes, surcharges, fees, levies, co-contributions, fines and other language that means taxes.
  2. Sale of assets. Such as airports, highways, power plants, radio spectrum.
  3. Draw-down of previous surpluses.
  4. Borrowing money from capital markets. By selling government bonds.
Are monetary policy and fiscal policy independent?

John Hussman summarises best though this is a more advanced concept (albeit in a US environment. Swap Federal Reserve for your local central bank, and Congress for your local Government).

There is a simple way to think about the relationship between fiscal policy (government spending, taxes) and monetary policy (money supply, interest rates). It is what economists call the Government Budget Constraint

Government Spending = Tax Revenues + Change in Bonds held by Public + Change in Bonds held by Federal Reserve

What this says is that there are literally only 3 ways to finance government spending.

  1. Increase tax revenues. Note that this is not necessarily accomplished best by raising tax rates. Regardless of how high the government has set top tax rates, government revenues have consistently hovered between 19% and 19.5% of GDP. The high deficits of the recent past are due to growth in the government share of GDP from about 19% in the 1960's to nearly 23% currently. This growth has been due primarily to an increase in Social Services expenditures such as Medicaid and Social Security. The share of GDP allocated to infrastructure (highways, telecommunications) as well as basic research has actually declined.

  2. Sell bonds to the public. This borrowing from the public is the primary means of financing the government deficit. Other things being equal, if the government issues more bonds, the price of those bonds tends to decline, meaning that interest rates tend to rise. This does not mean that a government deficit raises interest rates (there is no statistical evidence to support this notion). The true burden of government is not how much it borrows, but how much it spends. If the government decides to raise taxes rather than borrow from the bond market, it is true that investors will need to buy fewer bonds, but only because they also will have less to invest (due to the higher taxes, which almost always fall on those individuals with the highest savings rate). Raising taxes to cut the deficit therefore does nothing to increase the supply of funds available to other borrowers, and therefore nothing to reduce the level of interest rates. A cut in government spending does increase the supply of funds available to private borrowers. This is particularly true if the tax and regulatory environment is friendly to investment, which can then offset the cut in government spending without a decline in GDP.

  3. Sell bonds to the Federal Reserve. This is another way of saying print money.

In short, the Federal Reserve is not nearly as independent as it may appear. The Fed has the choice of whether government liabilities take the form of bonds held by the public, or money held by the public. The Federal Reserve can alter the mix of government liabilities (bonds held by the public vs. money held by the public), but the total amount of these liabilities is determined by fiscal policy, not monetary policy. The Fed can affect whether excessive government spending results in tight bank credit or high inflation, but it cannot prevent both unless Congress controls the growth of government spending itself.

Monday, July 14, 2008

Global Money Supply

In this post we look at Global Money Supply (M0 to M3). For a primer look at 'What is money' and 'What is money supply, inflation?'. But first a massive hat tip to Mike Hewitt at DollarDaze.org for his 2008 Global Money Supply update.

First, a table showing global money supply by the top 25 nations. Note that China, Russia, India and Norway did not publish M3, so an average multiple on M1 was used to estimate that data.

There are two very interesting facts in this table. The first is that top 6 countries account for 80% of M3, and the top 9 for 90%. Second, note that the average M3:M1 multiple is 19.4. This means that there is nearly 20 times more money in circulation that the money 'officially' printed by the respective central banks. Welcome to fractional reserve banking. This is consistent with an average 5% reserve requirement. See 'What is reserve banking?' for more information.

The next table looks at money growth for the same 25 nations ranked according to M0 year on year (yoy) growth. The rows shaded green show the top 6 (top 80%) nations according to M3 from above.

What is interesting in this table are the different growth rates for different countries. Since M0 is central bank control money, this is the best indication of what nations are doing. As of July 2008, we see the US and Japan having very slow money expansion, where as developing nations and petro-nations have high money growth. The reason for this high money growth is that these nations seek to maintain currency parity with the US dollar. So as the US dollar falls (becomes worth less for domestic economic weakness), these nations must print and sell their currency to maintain parity.

This excessive money printing is responsible for inflation in these nations. Remember to quote 'inflation is always and everywhere a monetary phenomenon' and you'll sound like an economist!

One last point, M3 can be a misleading money growth indicator as it captures large sums of money in money market accounts and liquid assets. During turning points in the economy, risk-adverse investors may sell assets such as property and equities and place this money in M3 type accounts. Of course this doesn't change the amount of money, just it's composition.

More to follow!

Bonds, inflation and the economy

In 'What is net present value?' and 'What are bonds, treasuries and corporate debt?' we looked at bond basics and bond fundamentals. Here we look at more advanced types of bonds and how they are influenced by the economy and inflation.

Let's be clear about how bonds work. Bonds are purchased for the current value (CV) of their future cash flow values (FV). For short term bonds such as overnight, 13 weeks or 1 year instruments this isn't hard to calculate. But when you work with long bonds such as a 30 year bond you need to be highly accurate with one variable...the discount rate. To show consider a special type of bond called a zero coupon bond. This bond pays no annual interest, instead returning the nominal principal amount at a date in the future. Let's consider a 30 year $1 billion zero coupon bond, with a discount rate of 4.22% and 5.30%. How much would you pay for this particular bond?

CV = $1B/(1+0.0422)^30 = $212.4 million (or a 79% discount to nominal)
CV = $1B/(1+0.0530)^30 = $289.4 million (or a 71% discount to nominal)

So for a 1.08% difference in the discount rate, this bond gained or lost 8% or $77.0 million. If you think this is not likely, look at the chart below (www.yahoo.com). This shows the implied yield (discount rate) on a 30yr US treasury.
As you can see the market is uncertain about the discount assumptions to make for such a long period of time. To see how these discount rate uncertainties translate into bond prices, let's look at two long bond ETFs (Vanguard - TLV, and SPDR Lehman - TLO). As you can see bonds can be a volatile investment, particularly at the long end of the yield curve.
The level of bond yields (discount rates) at different timeframes tells you a lot about the economy. Consider the following chart from Mike 'Mish' Shedlock, one of my favourite bloggers.
Looking at the 3 and 5yr US treasuries, we can see how bond market traders in late 2000 switched from worrying about inflation (high discount rate) to worrying about a recession. This is because the bond discount rate is basically made up of the markets opinion about inflation and economic activity. Shown below is the 'yield curve' for July 2008. This shows the forward yield estimates (discount rate) for different treasuries at different timeframes. Click here to go to this site which also shows a dynamic yield curve corresponding to the S&P500 over the last 6 or so years. A great feature.
The bond punch line... finally.
The reason bonds are so important is that there are trillions of dollars in bonds outstanding. Bonds are used to fund government debt (huge for the US and EU), corporate debt (huge for financial companies) and private debt (home loans, credit card debt, student loans). The bond market is at the heart of the credit crisis because bond holder demand higher returns (interest rates) when inflation or uncertainty rises. This raises the cost of borrowing for EVERYONE and why the mandate of central banks is price stability which by default means low and steady bond yields.

Next the great moderation and peak-credit. Peak oil is an insect bite compared to peak-credit!

What is net present value?

Would you prefer $50 now, or $100 in 12 months time? If you live in the US or Australia, you'd prefer the latter. If you live in Zimbabwe or 1920's Germany, you'd much prefer the former. Why the difference?

Let's pretend your an investor who only invests in term (certificate) deposits, and the current interest rate is 10%. So $100 invested now will be worth $110 in 1 year. The future value (FV) is a function of current value (CV) and interest rate (IR) as follows:

FV = CV*(1+IR)
$110 = $100*(1+0.10)

Let's reverse the equation and find out what the CV of $100 in 1 years time is.

CV = FV/(1+IR)
CV = $100/(1+0.10)
CV = $91

This makes sense. If we put $91 in a term deposit at 10% for 1 year, we'd have $100 at the end.

We can also look out past 1 year by modifying the equation. Suppose we were promised $100 in five years time when the interest rate is 10%. How much is this worth?

CV = $100/[(1+IR)*(1+IR)*(1+IR)*(1+IR)*(1+IR)]
CV = $100/(1+0.10)^5
CV = $100/1.61
CV = $62.09

What this says is that if I took $62.09 and invested it for 5 years at 10% I would have $100 (the promised amount). But the really interesting thing is changes in CV as a result of IR. Suppose we look at an IR of 2% and 20% over 5 years with an FV again of $100.

CV = $100/(1+0.02)^5 = $90.57
CV = $100/(1+0.10)^5 = $62.09
CV = $100/(1+0.20)^5 = $40.19

The CV changes are dramatic, from -9% nominal, to -60%. The graph below shows the CV of a promised $100 in 5 and 10 years at different interest rates.
What is significant is just how quickly high interest rates reduce the current value of future money. This simple financial fact is one of the most important in finance. It helps us value bonds, shares and compare different investment opportunities. Check the articles index for more.

Saturday, July 12, 2008

When to invest. The cycle of market emotions

When to invest?
Here is a useful tool that works in pretty much any market.

Investing involves a lot of group behaviour, especially when the asset class is real estate or dot-com equitites. Think of the NASDAQ in 1999, and US/global real estate from 2001-2006.

By reviewing the market emotions by talking to investors or listening to the media you can get a sense of where on the roller coaster we are. Enjoy!


What are bonds, treasuries or corporate debt?

In what are bonds, treasuries or corporate debt we look at bonds, bond pricing and how they are affected by expected returns.

A bond is simply a loan. Bonds, treasuries and corporate debt are all loans from savers (who have money), to debtors (who need money) such as governments (treasuries), or companies (corporate debt). Although the loan comes in many types, the loan is usually an interest only loan for the duration, with the principle (in nominal terms) returned at the end of the loan. In normal finance, a borrower borrows money from a lender and pays an interest rate. In bond language, the issuer borrows money from the bond holder and pays interest at the coupon rate.

Little people/companies borrow money from banks who in turn get their funds from the bond market. Big companies or governments bypass the banks and borrow (raise) their money by selling bonds direct to investors. These bonds can then be traded between borrows just as shares are traded on indexes.

Let's say a government is selling $1 billion in 10 year government treasuries (bonds) with a coupon rate of 10%. Investors buy the bonds from the government (buy handing over $1B), and the government agrees to pay the investor 10% of $1B every year ($100M) for 10 years, and then return the original $1B.

Given that bond holder receives his payback over time, we need to understand net present value in order to value the bond. Suppose we consider a government that needs to raise money to give away to taxpayers to prop up a failing economy. Suppose the bonds it intends to sell at 5 year treasuries with a 10% coupon rate and nominal price of $100 billion. The prevailing interest rate is 5%. This means the government will give the bond holder $10 billion every year for 5 years and then return the original $100 billion. Since we know what NPV is we can calculate the current value of that as follows:
  • Year 1. $9.52B = $10B/(1+0.05)^1
  • Year 2. $9.07B = $10B/(1+0.05)^2
  • Year 3. $8.64B = $10B/(1+0.05)^3
  • Year 4. $8.23B = $10B/(1+0.05)^4
  • Year 5. $7.83B = $10B/(1+0.05)^5
  • Year 5. $78.35B = $100B/(1+0.05)^5
So adding up the CV of each element we derive a bond CV of $121.6 billion. We mentioned before that bonds (future cash flows from borrows) can be traded like shares. Suppose 1 day after this bond commenced trading we had an inflation spike (caused by a falling currency and rising commodities prices) and the bond interest rate went up to 8%. Sparing you the maths (just replace '0.05' above with '0.08') the current price of the now 1 day old bond is...

$108.0 billion. The original owner of this bond just lost $13.66B or 11%. If you haven't worked it out yet, bonds are really important and you can make or lose a lot of money. In 'How are bonds and inflation related?' we look in more detail at the importance of bonds in the economy. In 'How much money did Asia and the middle-East just lose?' we look at global bond trading.

Friday, July 11, 2008

What is Fractional Reserve Banking?

Here we look at the history, function, operation and some criticisms of fractional reserve banking. This is important as most every nation has a FRB system in place.

History

In the middle ages goldsmiths would take deposits of gold/silver coins and issue 'goldsmiths notes' to depositers. Over time these notes became a trusted medium of exchange. Soon goldsmiths realised not everyone would want their gold at the same time and began to issue more 'goldsmith notes' in loans than they had in actual gold. Thus were born the first banks which paid interest to creditors (depositers of gold/silver) and received interest from a greater pool of debtors (people the bank loaned money to).

Function

The US Federal Reserve summarises FRB:
Banks borrow funds from their depositors (those with savings) and in turn lend those funds to the banks’ borrowers (those in need of funds). Banks make money by charging borrowers more for a loan (a higher percentage interest rate) than is paid to depositors for use of their money... For the economy and the banking system as a whole, the practice of keeping only a fraction of deposits on hand has an important cumulative effect. Referred to as the fractional reserve system, it permits the banking system to create "money".


Money Creation

Modern banks start with money from the nations central bank (M0). From here the amount of commercial bank money created through loans depends on the reserve requirements of the bank. From the NY Fed:
If the reserve requirement is 10%, for example, a bank that receives a $100 deposit may lend out $90 of that deposit. If the borrower then writes a check to someone who deposits the $90, the bank receiving that deposit can lend out $81. As the process continues, the banking system can expand the initial deposit of $100 into a maximum of $1,000 of money ($100+$90+81+$72.90+...=$1,000).


Control of Money Supply (and inflation?)

We see that the money supply is either central bank money (M0) or commercial bank money (M1-M3). We also know that inflation is 'always and everywhere a monetary phenomenon'. So how can central banks control money supply?
  • Central bank money. Central banks can directly adjust their supply of money as they control the physical (notes/coin) and electronic creation of money.
  • Commercial bank money. Central banks control this through regulation by changing the reserve requirements on banks. For example, a 10% reserve requirement enables $100 to become $1000. A 20% reserve requirement reduces that figure to $500. Capital ratio requirements also limit the types of loans banks can make (more low risk loans, fewer high risk loans).
Criticisms of Fractional Reserve Banking

There are two general criticisms of FRB. The first is that changes in money supply rely on the commercial bank lending process. When contracting money supply, this can be achieve easily as bank foreclose or withdraw credit in response to higher central bank imposed interest rates or reserve requirements. However, when seeking to expand money supply, the bank must have a willing borrower to borrow the new funds into existence. When the economy enters a down turn, borrows may not be willing to do this. Thus lowering interest rates and/or reserve requirements in a slow economy can be like 'pushing on a string'.

The second criticism is that increasing money supply artificially through money creation effectively lowers the cost of money (interest rates) through a simple supply demand mechanism (more money than goods). Alternatively, reducing money supply can create money shortages (for loans etc) which pushes up interest rates. Low interest rates can lead to over investment in unproductive assets (such as US housing from 2002-2006). High interest rates can lead to under investment in assets needed for current and future productive capacity.

Business cycle recessions are seen by Austrian School economics (more later) as necessary to liquidate unprofitable investments made due to artificially low interest rates. Once liquidated, capital is freed up for new investment in productive assets to take place.

What is Money Supply, Inflation?

In ‘What is Money Supply?’ we look at different types of money, where it comes from and what it means for the economy.

Money supply

Money supply (sometimes called money stock) is the total amount of money held by the non-bank public. When classifying money we generally separate categories as follows (note different countries do this differently):

  • M0. All physical currency (notes & coin), as well as central bank accounts that can be exchanged for physical currency (see what is money)
  • M1. M0 plus money in checking or current
  • M2. M1 plus most savings accounts, money market accounts, and small term deposits (certificates of deposit).
  • M3. M2 plus all other term deposits (CDs), institutional money-market funds, repurchase agreements and other large liquid assets.
The practice of fractional-reserve banking leads to large variations in money supply.

Fractional-reserve banking

Most nations use fractional-reserve banking. When banks give out loans in fractional-reserve banking a new type of non-M0 money is created (the M1-M3 components). Large differences in the different types of money exist based on bank margin requirements. The above image shows money supply for the US (www.dollardaze.org). FRB is covered in more details in a dedicated post.

Money and inflation

The money supply equation (MV=PQ) provides a useful framework for considering the link between money supply and inflation. Here:
  • M is the total supply (M0 to M3) of a nation.
  • V is the velocity of money measured as the number of times per year each dollar is spent.
  • P is the average price of all goods and services sold during the year.
  • Q is the quantity of all goods and services sold during the year.
We simply here that if money (M) is expanded through excessive fiat money printing, then the average prices of goods and services (P) will increase. Provided money velocity and the quantity of goods and services remains constant. The increases in prices (P) will be called inflationary and a nations reserve bank will look to target that figure to the 1-3% range depending on the country.

So what is inflation?

A simple definition is that it is 'rising prices'. But that is just the symptom. What is the cause of inflation? Inflation is believed to be caused by excess money supply (fiat money printing). This was famously acknowledged by Milton Friedman with 'inflation is always and everywhere a monetary phenomenon'.

It is also important to understand that inflation measures such as the consumer price index (CPI) are an overall economic indicator. Like all averages, CPI is made up of rising and falling components. Lets look at different components:
  • Rising: Food, fuel, healthcare
  • Steady: Housing costs*
  • Falling: Consumer electronics, automobiles, clothing
How you perceive inflation depends on where you live and the type of purchases you make. Let's consider three different countries:
  • Indonesia: majority of purchases are food/fuel related. Indonesian's are experiencing very high inflation:
  • USA: mix of food/fuel/housing expenses. Food/fuel are rising, however costs of housing are falling (July 2008). If you are buying a house then you stand to benefit from a large price decline (deflation) in housing saving you potentially tens or hundreds of thousands. If you already have a house, you are seeing only rising prices for food/fuel which is inflationary.
  • Australia: mix of food/fuel/housing expenses. Food/fuel are rising, but with its booming economy, rising interest rates (not falling like in the US) is making housing and rents more expensive! Inflation in Australia is over 4% and the populace knows it.
In 'What is fractional reserve banking' and 'How to benefit from inflation' we look in more detail at these issues.

Curious readers can find out more about money supply

What is Money?

Seems a simple question but the definitions of money and credit and their importance are aggressively debated by the best economic minds. Read on to see why.

Money is anything that is generally accepted as payment for goods and services and repayment of debts. Conventional opinion has it that money includes currency (circulating currency with legal tender status), and various forms of financial accounts such as savings, deposit, cheque and term deposits.

Money is an important part of an economy. With out money, two parties to a transaction must not only agree on a ‘price’, but also the medium of exchange. For example, I might well believe the car wash was worth two goats, but I may only have two sheep to pay with (which might be unacceptable to the car washer). Such friction results in higher economic costs.

Money is considered to be 1) a store of value, 2) a unit of account, and 3) a medium of exchange. Noted economists argue for distinguishing among different types of money as follows:

  1. Commodity money is that actually contains its purported economic value. That is, a gold coin stamped ‘$50’ is actually worth $50 in real gold value. Historical examples of commodity money include gold/silver coins, copper, shells, precious stones and so on.
  2. Representative money consists of token coins, notes or electronic certificates that can be swapped for a quantity of real commodity such as gold. It represents a real and direct relationship to a known quantity. For example, the US 1913 $50 Gold Certificate was “Fifty Dollars in Gold Coin Payable To The Bearer On Demand.”
  3. Credit money is any future claim, such as an I.O.U., against a physical or legal person that can be used to purchase goods and services. Other examples include treasury, savings or corporate bonds, or bank money market account not immediately redeemable.
  4. Fiat money is any money whose value is determined by a government act, and declared to be officially recognised payment for all debts, both private and public.
Regarding fiat money, consider the US 1914 $1 Bank Note after the introduction of the US Federal Reserve. At the time it was issued, a ‘note’ was well understood to be a promise of payment. And what is this Note redeemable in? Here's what it says: "Secured By United States Certificates Of Indebtedness Or One-Year Gold Notes, Deposited With The Treasurer Of The United States Of America". The Note was directly redeemable in Treasury debt, but it was not directly redeemable in Gold.

Now fast forward to 1963 and the US $1 note simply states: “This Note Is Legal Tender For All Debts Public And Private”.

Fiat money has advantages over commodity money in that it can be ‘replaced’ if the note is lost or damaged, unlike commodity money which is lost for good. Fiat money has several disadvantages though:

  • The stability of fiat money is related to the stability of the government system declaring the money into existence. Any failure of the government which issues the legal tender will undermine the value of that money.
  • If the declaring government issues more fiat money than available goods and services, then higher prices will likely result (defined as inflationary in some circles). 1920’s Germany or current-day examples of nations experiencing hyper-inflation as a result of excess (fiat) money printing.

Most all modern nations adopt fiat money management by a Federal Reserve banking system.

Wikipedia provides a more detailed summary on the 'History of Money', reproduced here for reader ease:

According to some fables, inventors of money were Demodike (or Hermodike) of Kymi (the wife of Midas), Lykos (son of Pandion II and ancestor of the Lycians) and Erichthonius, the Lydians or the Naxians. However, the use of proto-money may date back to at least 100,000 years ago, and the use of precious metals as money dates back at least 6000 years. The use of gold as money has been traced back to the fourth millennium B.C. when the Egyptians used gold bars of a set weight as a medium of exchange, as the Sumerians had done somewhat earlier with silver bars. Coins or at least minted tokens of a fixed value first appear in the 7th century BC in Greece. The first banknotes was used in China in the 7th century, and the first in Europe was issued by Stockholms Banco in 1661.”

Curious readers can find out more about 'A History of US Paper Money' here with thanks to www.the-privateer.com.

  • ‘A History of U.S. Paper Money': http://www.the-privateer.com/paper.html
  • Money: http://en.wikipedia.org/wiki/Money


Welcome to the Suburban Economic Investor

Hi there, and welcome to the SEI.

Why start the Suburban Economic Investor?

It took me a long time to work out that I was responsible for my own wealth, my own time, my own investments, my own career. About a decade in fact ... what a waste. Such lost opportunity. Over the last 8 years I've been on a knowledge quest in all areas covering the economy, investing, asset classes, business cycles and financial literacy. I think I've come a long way and want to share that information.

My main reason for sharing is to spare readers the lost opportunity that I (and my generation) have endured. I also have an eye to the next generation, particularly my two children who hopefully will be really getting into this blog circa 2014. I've got a lot of work to do between now and then.

So what is the Suburban Economic Investor about?

The SEI has two main themes.
  1. SEI contains a concise series of blogs/articles that cover all the essential information one needs to truly make independent investment, financial and career decisions.
  2. SEI surveys the global economy monthly, providing a concise information on the current state and future implications.
By combining these two themes, economic and investing theory with current economic state, readers should be able to form a good global picture and make informed decisions.

What does economics and investing have to do with wealth?

Here are my two simple definitions for economics and investing:
  • Economics - relates to the allocation of scarce resources with alternative uses.
  • Investing - relates to the allocation of scarce resources to enhance personal wealth
  • Wealth - relates to the total value of an individuals possessions (friends, experiences, love, money, skills)
  • Resources - time, capital (or money), energy, physical items, ideas
Whether we are aware of it or not, we invest our scarce resources using economic principles, in the hope that we will improve our overall wealth. If you don't know about economic, investing or wealth principles you may be missing out on some personal wealth.

How do I best use the Suburban Economic Investor?

I aim to publish around 1-2 articles per week, plus a quality monthly summary on the state of the global economy. The idea is that articles on this blog should explain the concepts covered in the global summary.

I recommend you visit my blog weekly, or link up via the RSS setting the article count to 1-2. Send my link to those you know that would like to learn more about the economy, investing and wealth; as well as the current state of the economy. If there is anything you'd like to know more about, drop me a message. I'll get around to publishing something on it.

Eventually you'll be full bottle on this stuff and getting into blogs from real economists and investors. When you do, be sure to share the link.

Enjoy!